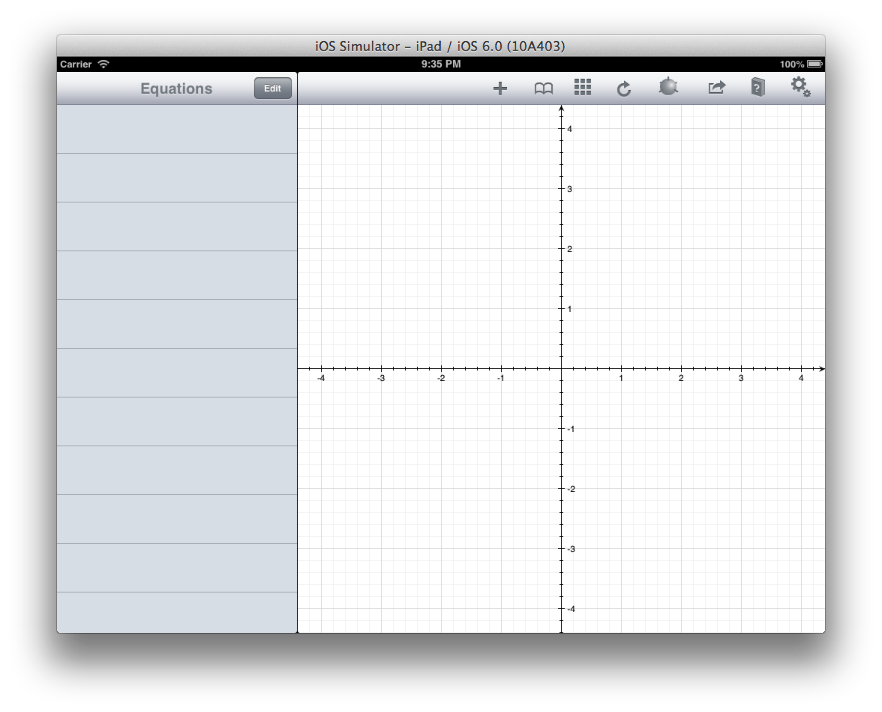
Overview

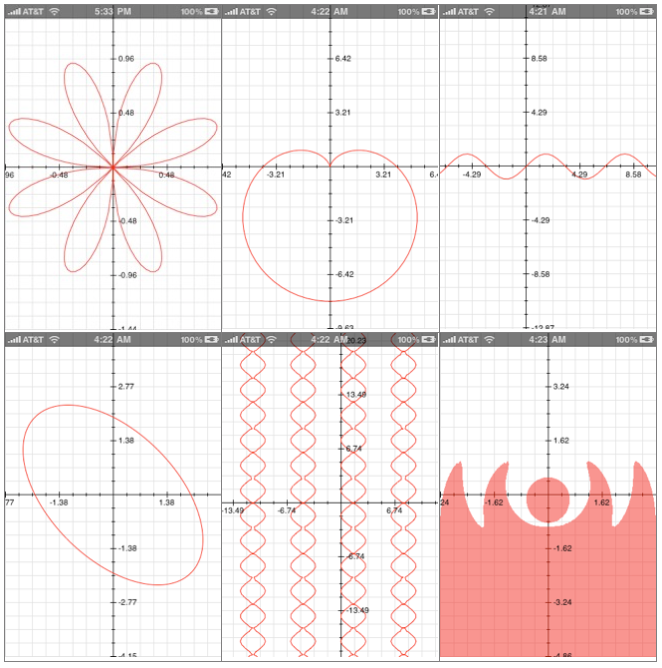
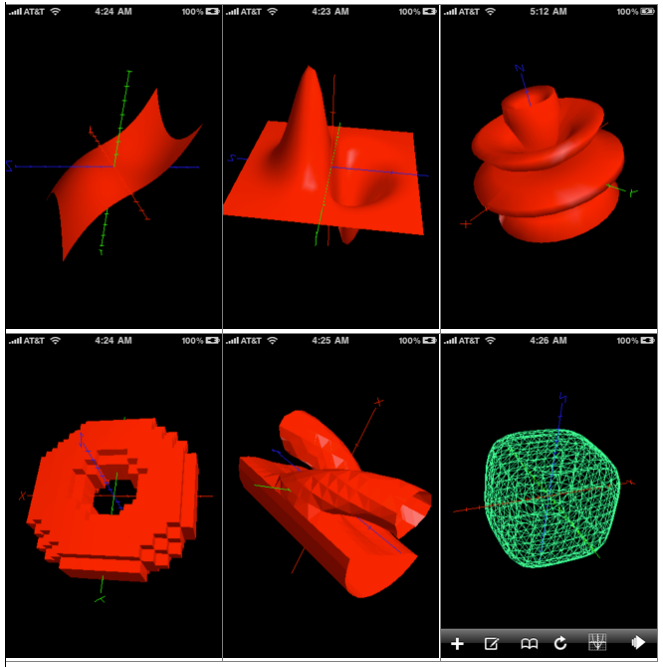
Thank you for using Quick Graph and voting it as the best graphing calculator available on the AppStore! It is a powerful, high quality, graphic calculator that takes full advantage of the multitouch display and the powerful graphic capabilities of the iPad and iPhone, both in 2D and 3D. A simple, yet intuitive interface that makes it easy to enter and/or edit equations and visualize them in mathematical notation. It's capable of displaying explicit and implicit equations as well as inequalities in both 2D and 3D, in all standard coordinate systems: cartesian, polar, spherical and cylindrical, all with amazing speed and beautiful results, which can be copied, emailed or saved to the photo library.

Features

  • Support for a wide variety of standard mathematical functions.
  • Easy to use interface.
  • Cartesian/Polar coordinates in 2D.
  • Cartesian/Cylindrical/Spherical coordinates in 3D.
  • The coordinate system to use is inferred from the expression.
  • Plot mlitiple equations
  • Built in library with the ability to include custom equations
  • Easily zoom in and out on the graph
  • Copy the current graph to the clipboard
  • Built-in user manual
  • 2D and 3D graphing of explicit equations in all supported coordinate systems.
  • Hyperbolic functions / inverses
  • Landscape and portrait support
  • Wireframe and solid visualization in 3D
  • Adaptive 2D and 3D algorithms
  • Enhanced 2D mode for great hi-res graphics
  • Swipe to delete equations from the equation list
  • Shake to reset view to original state, or to clear entry fields
  • In-app email so you can share graphics and equations
  • Save to photo library
  • Share graphs using Twitter
  • Symbolic Derivatives
  • Interactive expression evaluation
  • Turn individual graphs on/off
  • Change graph’s color and blending
  • Axis lock in 3D for easier visualization
  • Equation labeling


  • Optional features

    (Quick Graph Only)


    Even though all the standard features that made Quick Graph a great app are free, you can opt to unlock additional features (below, via in-app purchase). Upgrading Quick Graph to unlock the additional features will not only enhance your user experience, but it will also support the developing of Quick Graph!

  • Support for a wide variety of standard mathematical functions.
  • 2D Tracing (trace the coordinates along the graphs)
  • VGA Out
  • 2D and 3D implicit graphs
  • 2D and 3D inequalities
  • Asymmetric 2D zoom
  • Unlimited graphs
  • Table of values
  • Roots and intercepts visualization in 2D


  • Quick Graph+ or Quick Graph with Optional features

    Quick Graph+ differs from the free Quick Graph in that it already includes the advanced feature set which gives you access to all the features, such as implicit graphs and tracing.

    Symbols, Variables and functions

    The keyboard of Quick Graph on the iPhone or the iPad has the following math operators, variables, constants and functions, that can be used to plot 2D and 3D Graphs and calculation (see Figure 1):


    Operators:

    + Plus - minus * Multiplication / Division
    ntnh root ^ Power () Parentheses , Parameter Separator
    ; Expression separator < Less than > Greater than = Equality and assignment

    Note: roots should be typed as (degree)√(expression), square root is a special case, where you can enter 2√x or √x, as long as there’s no expression to the left of the √ symbol (except for an operator).


    Variables:
    x, y, z, r, Θ, Φ
    Constants:
    π, e


    functions:

    sin: sine cos: cosine tan: tangent
    cot: cotangent sec: secant csc: cosecant
    asin: arc sine acos: arc cosine atan: arc tangent
    sinh: hyperbolic sine cosh: hyperbolic cosine tanh: hyperbolic tangent
    coth: hyperbolic cotangent csch: hyperbolic cosecant sech: hyperbolic secant
    d/dx: x derivative d/dy: y derivative d/dz: z derivative
    ln: natural logarithm log: base 10 logarithm log2: base 2 logarithm
    abs: Absolute Value ceil: next closest integer floor: previous closest integer
    If(condition, true, false) max min
    mod: remainder function todeg: to degrees torad: to radians

    Using Quick Graph

    When you first start the application a window similar to these will appear:

    Figure 2: iPad View
    Figure 3: iPhone/iPod View

    The tool bar

    The application toolbar has the following options:


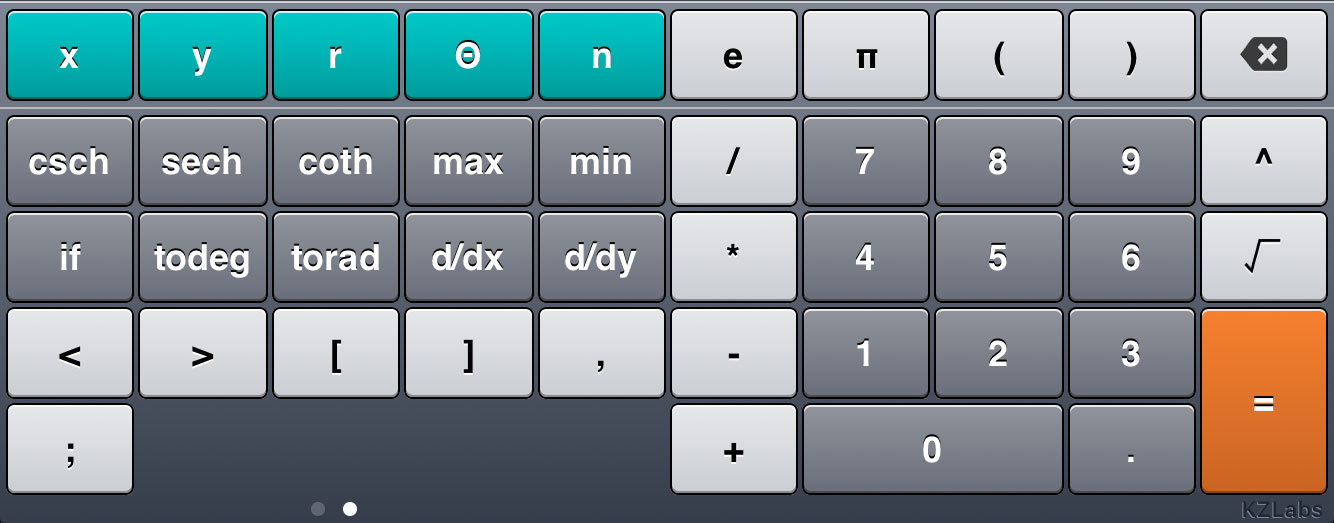
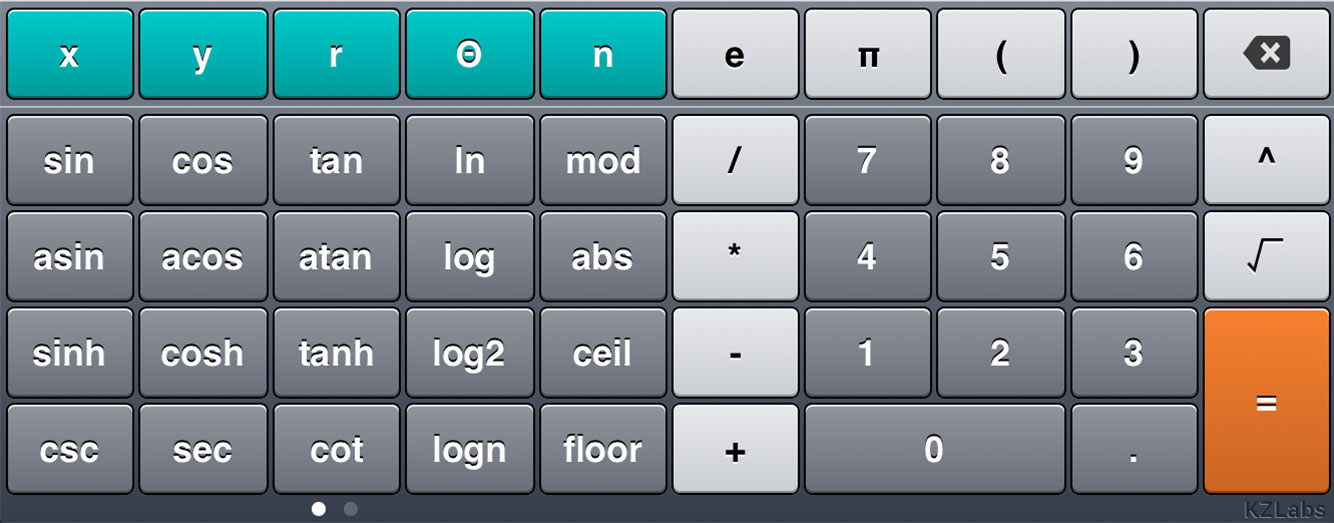
    Add: presents the application keyboard to start entering a new equation.
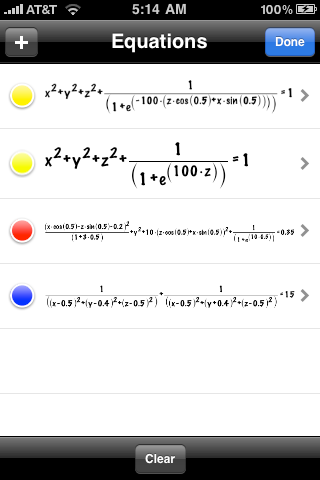
    Edit: shows a list of the current equations. Here you can change the color of the equation, add or remove one or all of the equations, hide and label equations.
    Library: displays the current library of expressions. You can choose one to graph immediately, or add expressions to the library.
    Reset: resets the view to its default settings. If you happen to have shakes enabled you can also shake your device to reset the view.
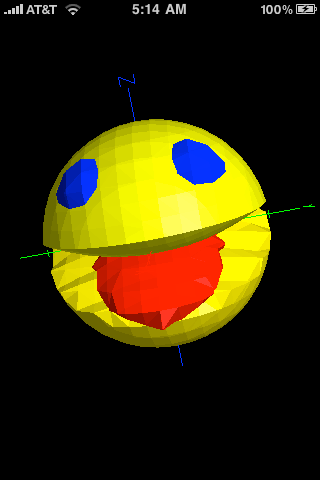
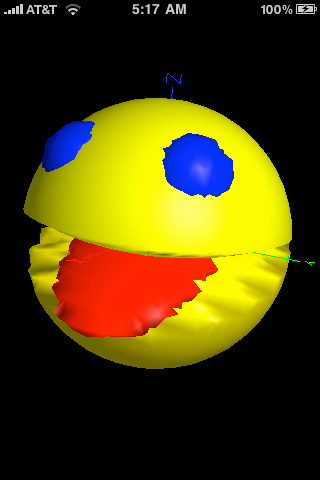
    Mode: changes the graphing mode from 2D to 3D and vice versa.
    Value table: Display a table of values for the current visible equations.
    More: displays the more options toolbar.
    Hide: Hide the more options toolbar.
    Action: allows you to copy the current graph to the clipboard, save it to your photo library, email the current graph as well as its related equations or tweet the image.
    help: displays this guide, the application’s credits, and allows you to email us directly.
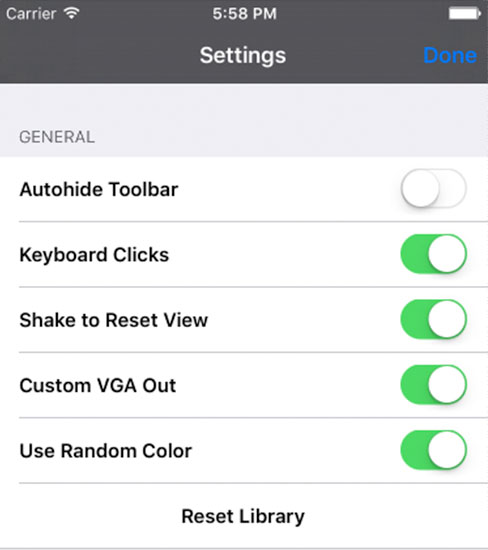
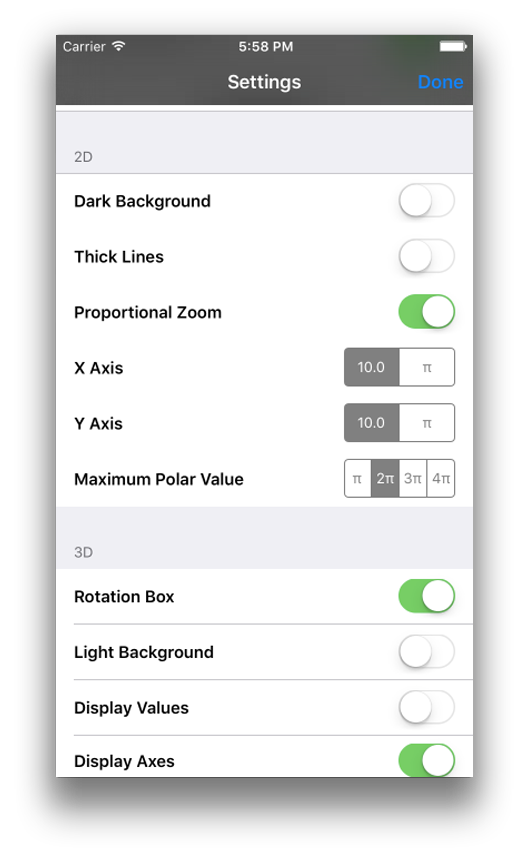
    Settings: Here you can change various settings in the application.

    Adding the first equation

    Now for the fun part, press the add button (the one that looks like a plus sign) and let’s start writing our first equation! You should see a keyboard similar to this (figure 4):

    Figure 4: Equation Editor
    TIP: You can use Quick Graph as your main calculator. To evaluate an expression, simply enter it as you would on a regular calculator: 5+5*3 (figure 4). The result will appear under the expression!

    Notice how next to the field to enter the expression,there is an icon that will allow you to browse the library of prebuilt equations. As you will learn later, QuickGraph also has a library that will allow you to save your own equations for future use. If you can’t see the icon,simply erase the equation from the field and tap on the library icon. You will see something like figure 5 but withyour own library. You can select or delete any equation from the library.


    Evaluating an expression with variables

    Quick Graph allows you to evaluate mathematical expressions that has variables as part of the expression. For example, with x=3, the expression 7x + 4 becomes 7 * 3 + 4 which is equal to 21 + 4 or 25. Figure 6 shows an example about how to evaluate an expression with a variable using Quick Graph.

    Figure 5: Library
    Figure 6: Evaluating an expression

    Its important to notice that you have to enter the evaluation point first and then the equation, separated by a semicolon (;)
    x=3 ; 7x+4

    Entering and graphing expressions

    An expression is a group of numbers, operators, variables, and functions or a combination ofthese elements. Now, go back to the new equation view, to plot a function simply enter: y=x^2 and tap the done button. If the expression contains an error, a message under the expression will appear describing it.

    Figure 7: Entering an equation
    Figure 8: Equation plotted

    Implicit Equations

    An expression is a group of numbers, operators, variables, and functions or a combination ofthese elements. Now, go back to the new equation view, to plot a function simply enter: y=x^2 and tap the done button. If the expression contains an error, a message under the expression will appear describing it.

    Figure 9: Implicit equation
    Figure 10: Inequality

    Inequality

    You can use trigonometric functions, inequalities, and a set of prebuilt functions that we will explore in depth in subsequent sections, for example y

    Trace

    The upgraded version also allows you to trace the graph by tapping and holding. A line will appear showing the intercepts with the graph (figure 11).

    Figure 11: Tracing

    Equation Colors

    You can change the color of the graph by selecting the edit option (second icon) and tap on the little color bullet to the right of the expression. (figure 12).

    Figure 12: Changing color

    Delete Equations

    Now, to erase equations (graphs), go to the edit view on the iPhone or to the equations view on the iPad, then simply click on the edit button or swipe across the graph you want to delete.

    Figure 13: Removing an equation

    Hide Equations Temporary

    In the edit view, you also have the possibility of turn on/off the equation, via the visibility icon:

    Figure 14: Library

    Add to library

    The library button opens a view where you can add your expressions to the library (if not already there) and can delete or select an equation to graph (figure 14)

    Figure 16: About

    Help

    The help button displays the application’s credits and a way to contact us, for queries or suggestions. (figure 16).

    Displaying the equation

    On the iPhone version you have the ability of displaying the equations graphed on the main screen, just press the gray disclosure triangle on the top left of the screen and it would show you the first equation, if you tap in the equation, it would display the next one. To close this just tap in the gray triangle.

    Figure 17: Display equation
    Figure 18: Roots and Intercepts

    Roots and Intercepts

    In 2D Quick Graph has the ability to calculate roots and intercepts of cartesian equations, just press the gray plus triangle on the top right during tracing and it will show you the options to calculate and display roots and intercepts. This can take a few seconds if many equations are plotted at the same time.

    Table of Values

    Quick Graph also lets you see a table of values for the current graphed equations. Scroll down to the top to see the limits and interval options. Tap on an equation to zoom on it.

    Figure 19: Table of values

    to the top to see the limits and interval options. Tap on an equation to zoom on it.

    Settings

    The settings button enables you to personalize Quick Graph for certain functionalities:

    General

    • Autohide toolbar (iPhone only): If you would like to have more room for visualization, the toolbar can be hidden, and it will appear again by tapping the bottom of the screen.
    • Keyboard Clicks: Turns on/off the clicking sound of the application keyboard.
    • Enable shakes: Allows you to shake your device to reset the view and to clear the text field in the add expression view.
    • Use random color: if enabled, every time a graph is added, it will be given a random color.
    • Default color: The default color for the graphs, if random color is turned off.
    • Reset library: Erases the library (2D and 3D) and restores the original equations.
    Figure 20-1: General Settings
    Figure 20-2: 2D and 3D settings

    2D

    • Dark background: Sets the background to black.
    • Thick Lines: Graphs will be displayed using a thicker 2 pixel line.

    3D

    • Rotation box: Enable/disable the rotation box.
    • Light Background: Change the background color of the 3D view to white.
    • Display Values: Displays the current values for the x, y and z axis.
    • Faster implicits: Turning off faster implicits will allow the use of a more complex algorithm to calculate implicit surfaces. The result will be a smoother surface, but it will require more time to calculate the graph (see graphs 28 and 29).

    General

    The last option in settings is the Optional Features. Figure 20-3 shows the option to unlock the advanced options.

    Figure 20-3: Unlock advance features (QG only)

    Sample Graphs

    TIPS

    3D

    The 3D view functionality is similar to the 2D view. However, there are some differences. For instance, instead of moving the graph by dragging you can rotate it. Also, if you want to move the graph you will need to drag two fingers. In figure 21 we can see the basic 3D view with its axis if you zoom in or zoom out, the equation will be recalculated with the new limits determined by the bounding box.
    Entering an equation in 3D is the same as in 2D (the same interface figure 22). Quick Graph will automatically give you messages if there is any error in the equation and a little marker will be set where the error can be found.

    Figure 21: 3D view

    Symbolic Derivatives

    One great functionality is that you can solve symbolic derivatives by tapping the plus button that appear under the equation when it contains a derivative (figure 23).

    Figure 22: Entering 3D equation
    Figure 23: Symbolic derivatives

    Visualization modes 3D

    The visualization of 3D equations is shown in figures 24 to 26. With double tap you can change the visualization mode, from points to wireframe to a solid surface.

    Figure 24: 3D Vetex
    Figure 25: 3D Wireframe
    Figure 26: 3D Solid

    The basic version will allow you to graph up to 6 equations. The enhanced version will allow you to graph unlimited equations (well, almost... there is still a limitation imposed by the available memory in your device).

    We encourage you to purchase the enhanced version to support the development of Quick Graph.

    Figure 27: Multiple equations
    Figure 28: A little tribute to another great graphing calculator!
    Figure 29: Faster implicits disabled